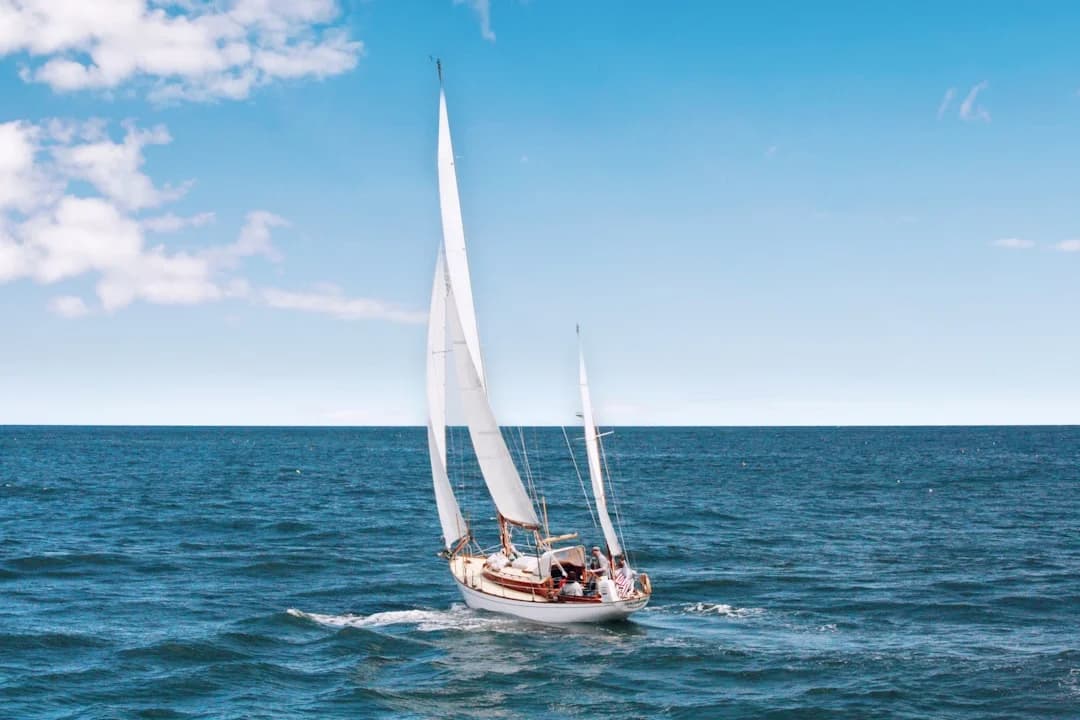
Sailboat Hull Speed: Calculate It and Exceed It
Sailboat hull speed is one of those dockside numbers that gets treated like a law of nature, right up until someone’s GPS shows a bigger number and the arguing starts. The truth is more interesting and more useful: “hull speed” is a shorthand for where wave-making resistance climbs fast on a displacement hull, typically around Froude number (Fn) ~0.35–0.45 and speed–length ratio (SLR) ~1.34.
If you’re cruising, the win isn’t bragging rights; it’s predicting passage time, choosing when to motor, and knowing when extra throttle is mostly noise and diesel. For passage planning, I’ll often sanity-check my estimates with a quick check of the nautical miles between ports—distance first, then realistic boatspeed targets, then currents and daylight.
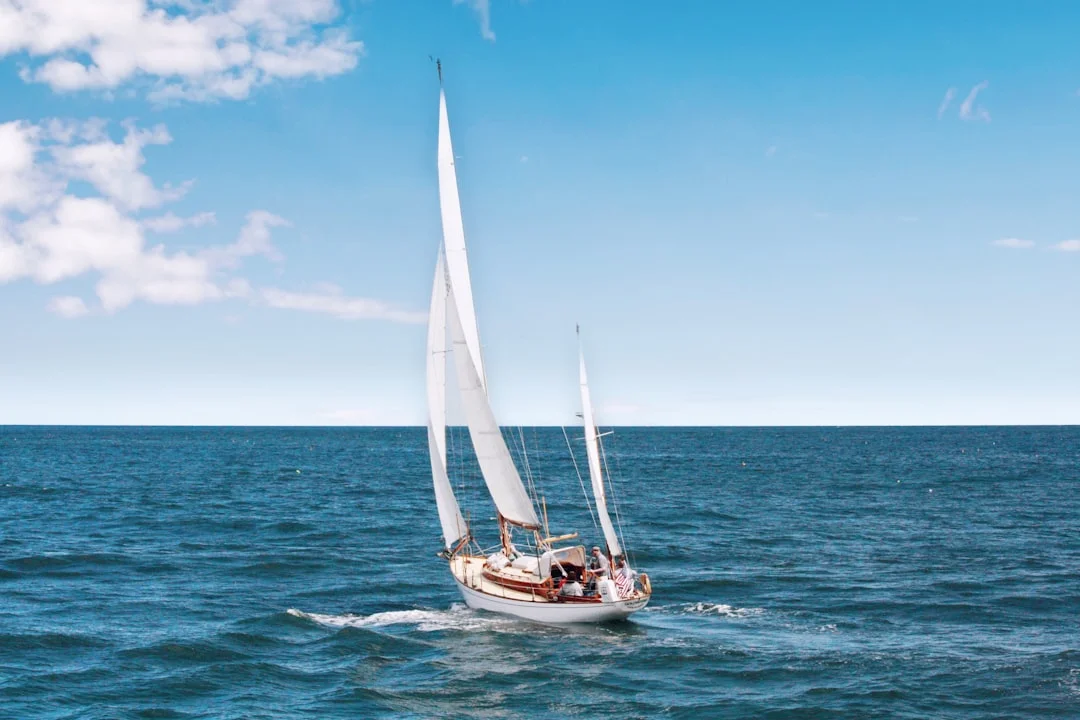
Photo by Kristel Hayes on Unsplash
What Sailboat Hull Speed Is (and What It Isn’t)
Hull speed as a resistance ‘hump,’ not a speed limit
“Hull speed” is best thought of as a resistance hump, not a hard ceiling. On a typical displacement monohull, you reach a point where small speed gains demand a lot more thrust because the boat starts spending more energy making a bigger wave system. That hump often lives around Fn ≈ 0.40 (roughly 0.35–0.45 depending on hull form), which is why the classic 1.34 rule usually feels “about right.”
It’s also not a regulation. The USCG doesn’t care about your hull speed, and neither does your insurance adjuster—until you stuff the bow and broach, at which point everyone suddenly cares about seamanship. Treat hull speed as a planning tool, not permission or prohibition.
Wave-making resistance and the stern wave story
The old explanation—“when wavelength equals waterline length”—is a decent mental picture, even if it’s simplified. As speed rises, the bow wave and stern wave lengthen and steepen, and the boat increasingly sits in a trough between them. Your wake gets sharper, the transom area changes behavior, and you’ll often feel the boat “dig in” as the stern wave grows.
Practically, this is where you’ll notice squat, a slightly heavier helm, and more noise from the wake. On many cruisers, the last 0.5–1.0 knot before the hump feels like you’re paying double for half the result—under sail or power.
Why some boats feel ‘stuck’ approaching hull speed
Some boats hit the hump like a brick wall; others smear right through it. Hull form matters: prismatic coefficient, immersed transom shape, and wetted surface area all change how sharply resistance rises. A heavy cruiser with a full keel and lots of wetted area may feel “stuck” at SLR ~1.25–1.35, while a lighter fin-keeler might keep building toward SLR ~1.4 before the real penalty arrives.
And yes, GPS screenshots lie all the time—usually because they’re showing SOG with current help. If you don’t separate speed through water (STW) from current, you’re not proving anything except that tides still work. Set expectations: the SLR ≈ 1.34 point is a useful estimate, while Fn and resistance curves explain the physics with fewer bar fights.
Hull Speed Formula: 1.34×√LWL (ft) + Examples
Imperial vs metric hull speed formula
The classic displacement estimate is: Vh (kn) = 1.34 × √LWL(ft). It’s an empirical shortcut tied to where wave-making resistance ramps up for many displacement hulls, not a universal constant handed down from Poseidon. In metric terms, a handy equivalent is Vh (kn) ≈ 2.43 × √LWL(m), which keeps everything in knots while using meters for length.
If you want a quick sanity check, use SLR = V(kn) / √LWL(ft). At “hull speed,” SLR comes out to about 1.34, which is exactly why the constant shows up.
Worked examples for common waterline lengths
Let’s do the math sailors actually do on a scrap of paper. For LWL = 30 ft, √30 = 5.477, so Vh = 1.34 × 5.477 = 7.34 kn. For LWL = 36 ft, √36 = 6.000, so Vh = 8.04 kn; for LWL = 40 ft, √40 = 6.325, so Vh = 8.48 kn.
If your boat never gets close to those numbers in decent wind, don’t blame “the formula.” First blame the usual suspects: bottom slime, tired sails, dragging prop, or an uncalibrated log that’s optimistic by 5%.
Quick reference values (table)
Here’s the quick-reference set I keep in my head when someone asks what a boat “should” do. The SLR at Vh is shown as ≈1.34 by definition.
| LWL (ft) | √LWL | Vh (kn) = 1.34×√LWL | SLR at Vh |
|---|---|---|---|
| 25 | 5.000 | 6.70 | 1.34 |
| 30 | 5.477 | 7.34 | 1.34 |
| 35 | 5.916 | 7.93 | 1.34 |
| 40 | 6.325 | 8.48 | 1.34 |
| 45 | 6.708 | 8.99 | 1.34 |

Photo by Karla Car on Unsplash
Which Length to Use: LOA vs LWL vs Effective LWL
ISO 8666 principal dimensions and finding true LWL
Use LWL, not LOA, for the hull speed formula—because wave-making behavior is tied to the length of hull interacting with the water. Builder brochures often toss around LOA because it sells boats and annoys marina managers, but ISO 8666 is the sensible reference for principal dimensions and consistent reporting. If your spec sheet lists “LWL” and it looks suspiciously close to LOA on a 1970s design, double-check it.
You can usually find LWL in the designer’s data sheet, class documents, or a measurement report. If all else fails, measure waterline length at rest, but understand it’s only a starting point.
How heel, trim, and loading change effective waterline
Underway, “effective LWL” changes with heel angle, trim, and load. A classic yacht with long overhangs may gain meaningful waterline when heeled 10–20°, which can slightly raise the speed you can carry before the hump feels dominant. That doesn’t mean the boat becomes a rocket ship; it means the resistance curve shifts a bit and the boat may feel happier at SLR 1.3–1.4 than it does upright.
Loading matters too. Add 800–1,200 lb of cruising gear, water, and chain, and you increase displacement and wetted surface, often making the hump feel earlier. Move weight forward and you’ll pay in pitching; move it aft and you may change transom immersion and drag.
Design evolution: overhang classics vs modern wide-sterns
Modern boats often have LWL close to LOA, wide sterns, and flatter runs aft. That tends to make them more willing to exceed the old displacement expectations, especially off the wind when they can surf. Meanwhile, older long-overhang boats may show “extra” speed when heeled because the ends immerse, but they still carry more wetted surface and often a more rounded underbody.
If you’re missing LWL, here’s a practical approach: compute Vh using your best estimate, then compare to observed best upwind STW in 12–18 kt true wind. If you’re consistently 0.8–1.5 kn below expectation, investigate bottom condition (a 10–20% loss from fouling is common), sail shape, rig tune, and speed sensor calibration.
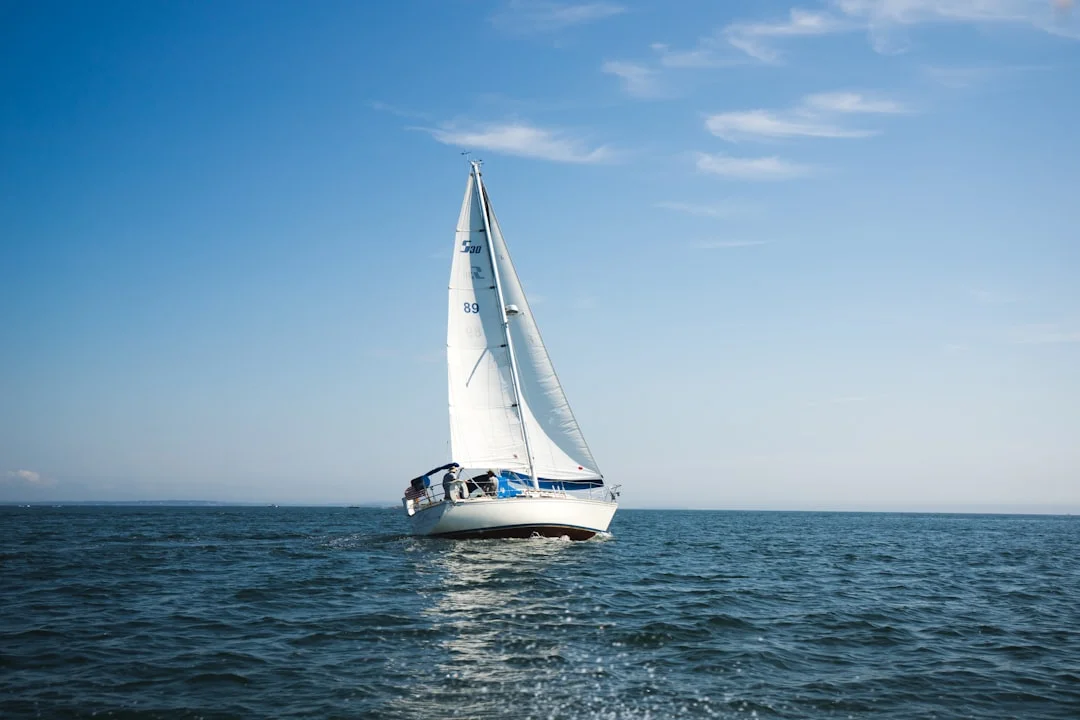
Photo by Evan Smogor on Unsplash
The Better Lens: Froude Number, SLR, and Resistance Curves
Froude number (Fn) and the wave-making onset
Froude number is the grown-up way to talk about hull speed without unit arguments. Fn = V / √(gL), with V in m/s, g = 9.81 m/s², and L typically taken as waterline length in meters. What Fn buys you is scale: two boats of different sizes behave similarly at the same Fn, even if their “hull speed” in knots differs.
Many displacement texts put the steep rise in wave-making resistance around Fn ≈ 0.40, with a contextual range of 0.35–0.45 depending on hull shape. That’s the resistance hump sailors feel.
Speed–length ratio (SLR) as a sailor’s shortcut
SLR is the sailor-friendly cousin of Fn: SLR = V(kn) / √LWL(ft). It’s not as physically pure, but it’s quick and matches common practice in yacht performance talk. The classic hull speed point is SLR ≈ 1.34, while sustained surfing/planing often shows SLR ~1.6–2.0 on modern light monohulls in the right conditions.
If you want to describe what’s happening without math, use these “feel” markers. Around SLR 1.2, the boat feels efficient and quiet; around 1.3–1.4, wake steepens and squat increases; above 1.5, you’re usually surfing, planing, or benefitting from a very slender hull.
What the resistance curve implies for engine power
Total resistance is roughly friction + wave-making, and the mix shifts with speed. Frictional resistance grows steadily with wetted surface area and speed, while wave-making resistance ramps hard as Fn approaches the hump. Hull form knobs—prismatic coefficient, immersed transom behavior, and wetted surface—reshape that curve, which is why two “40-footers” can feel wildly different at 7.8 vs 8.4 kn.
Here’s the cross-check that ties Fn back to the rule-of-thumb: take Fn = 0.40 and LWL = 10 m. V = 0.40 × √(9.81×10) = 3.96 m/s, which is 7.7 kn, very close to what the 1.34 rule predicts for ~33 ft LWL. The operational takeaway is blunt: the last 0.5–1.0 kn approaching the hump is often where fuel burn spikes, engine load rises, and you start bargaining with your conscience. If you’re logging RPM and burn rate, it helps to estimate your fuel needs based on the voyage distance and then overlay your “happy” cruise speed versus the hump.
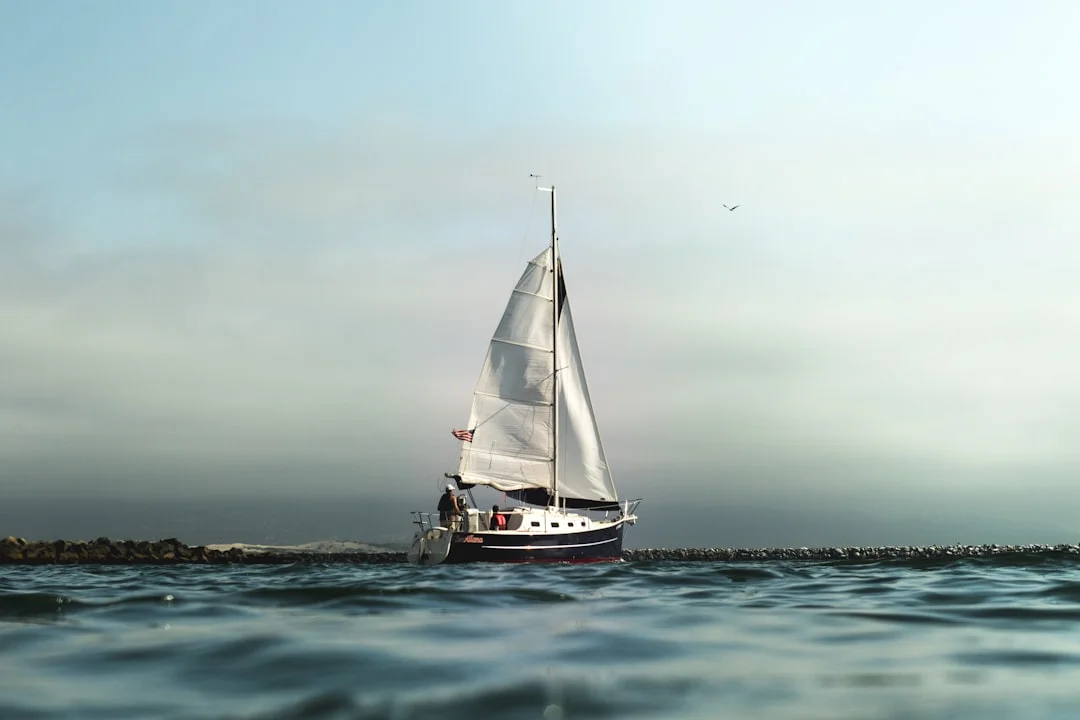
Photo by Jeremy Bishop on Unsplash
Practical tip: If your displacement cruiser motors happily at 6.5 kn but sounds miserable at 7.2 kn, that’s the hump talking. Log RPM, STW, and fuel burn; don’t guess.
When You Can Exceed Hull Speed: Surfing, Planing, Multihulls
Displacement vs semi-displacement vs planing behavior
“Exceeding hull speed” is real, but it usually means you’re no longer behaving like a classic displacement hull. Semi-displacement and planing boats climb onto a different resistance regime where dynamic lift carries some weight, reducing the wave-making penalty. Most cruising monohulls won’t truly plane, but many will surf, which is a free ride down a moving slope of water.
That’s why you’ll see bursts to SLR 1.6–2.0 in a good following sea, even if the boat’s comfortable upwind number is SLR 1.25–1.35. The physics didn’t break; the operating mode changed.
Light-displacement monohulls: surfing and stability limits
A handy predictor for planing tendency is displacement-to-length ratio (D/L). As a rough rule, D/L < ~200 is relatively light, and D/L < ~150 is very light and more likely to exceed hull speed by surfing/planing. The details still matter—stern shape, appendages, and how much weight you’ve loaded into the ends—but D/L is a good first sniff test.
Downwind surfing is also where seamanship gets real. Rudder loads increase fast at 9–12 kn on many cruisers, and autopilots that steer fine at 6.5 kn can suddenly look like they’ve lost interest in their job. Reef earlier than your ego wants, ease traveler before the boat rounds up, and remember that a broach at 10 knots turns the cockpit into a laundry machine.
Multihulls: slenderness ratio and lower wave-making drag
Multihulls exceed monohull “hull speed” estimates routinely because their hulls are slender, reducing wave-making resistance at a given speed. Slenderness ratio (conceptually, length relative to beam of each hull) is a big part of why a cruising cat can sit in the 8–12 kn range in moderate conditions without theatrics—assuming it’s not loaded like a floating storage unit. They also tend to have long effective LWL for the displacement carried, which keeps Fn lower for a given knots number.
The limit isn’t “hull speed”; it’s usually sail-carrying power, sea state, and safety margin. On multihulls especially, stability is less forgiving once you’re pressed; the penalties can arrive abruptly and without negotiation.

Photo by Ian Keefe on Unsplash

Photo by Daniel Stenholm on Unsplash
Proving You Beat Hull Speed: SOG vs STW, Current, Accuracy
SOG vs STW: why GPS can mislead
If your GPS says you did 9.0 kn on a boat with Vh ~7.3 kn, your first question should be: “Was that SOG or STW?” GNSS gives you SOG, which includes current, and in many places the tide will gift you 1–3 kn without asking. That’s great for the bar tab, but it’s not proof of hydrodynamic achievement.
To plan passages honestly, I use SOG for ETA only after I’ve accounted for current. Breezada’s sea distance calculator is handy here: combine distance with a realistic STW target, then adjust with forecast current to get a believable schedule.
Instrument accuracy, calibration, and fouling effects
Paddlewheel logs are useful, but their typical accuracy is often around ±2% to ±5%, and they get worse with fouling or a sticky wheel. GNSS SOG is often within ~0.1–0.2 kn under good reception, but again, it’s measuring a different thing. If your STW reads 7.6 and your SOG reads 8.8, that doesn’t mean you “beat hull speed” by 1.2 knots; it means you found a river in the ocean.
Bottom condition is the quiet thief in all of this. Heavy fouling commonly costs ~10%–20%+ of speed, while light slime can cost a few percent—enough to turn a theoretical 7.3 kn boat into a practical 6.6 kn boat.
A repeatable validation method (sea trial protocol)
If you want to validate performance, do it like a sea trial, not like a screenshot. Pick flat-ish water, steady wind, and do two reciprocal runs on opposite headings for 5–10 minutes each. Record SOG, STW, RPM (if motoring), and wind angle; then average the opposite headings to reduce current effect.
If you want to get serious, estimate the current vector from the difference between STW and SOG across headings, then compare your observed SLR to expectations. This is also where you’ll learn whether your speed transducer needs cleaning, your keel needs love, or your “new” sails are just expensive curtains.
Practical Speed Levers: Bottom, Prop Drag, Polars, Route Plan
Stop going slower: hull/appendage condition and wetted drag
The cheapest knot is usually a clean bottom, not a new gadget. In-water diver cleanings often run $2–$6/ft per visit, while haul and pressure wash might be $12–$25/ft. If you’re paying for a yard bottom paint job, expect $1,500–$5,000 for many 30–40 ft boats, depending on prep and region.
A clean hull won’t “break” hull speed, but it can restore the 10–20% you’ve been donating to barnacles. That’s the difference between reaching the hump in 15–18 knots true wind and wondering why your boat feels allergic to 7 knots.
Propeller drag and pitch vs hull speed under power
Under sail, a fixed prop can feel like towing a bucket. Folding and feathering props reduce drag and can deliver real cruising gains, with typical costs around $1,800–$6,000. Under power, prop pitch matters because the resistance hump makes the engine work harder for the last 0.5–1.0 kn; too much pitch can overload the engine before it reaches rated RPM, while too little pitch can leave efficiency on the table.
Repitching a fixed prop is often $150–$400, and it’s one of the few upgrades where a simple data log—RPM, STW, and fuel burn—can justify the spend. If you can’t hit within about 100–200 RPM of rated WOT (at normal load), something is mismatched, fouled, or both.
Polars, VMG, and route planning with realistic targets
Polars aren’t just for racers; they’re a reality check. A polar tells you the best target boatspeed for a given true wind speed and angle, which helps you decide whether to foot for speed or pinch for angle. For cruising, the real win is VMG (velocity made good): a slightly lower boatspeed at a better angle often arrives sooner than a heroic attempt to “hit hull speed” while crabbing sideways.
For passage planning, start with distance, then choose conservative target STW numbers—often well below Vh upwind—and finally add currents. Plan your route and timing with a sea-distance tool to make the distance part painless, and it helps keep your ETA grounded when the temptation is to assume “we’ll average 8 knots” on a loaded cruiser.
Costs and benefits: what’s worth doing first (table)
Here’s a practical comparison I’d use if I were budgeting for speed honestly. The “benefit” column is about mechanism—drag reduction, power delivery, or better data—because chasing numbers without knowing the mechanism is how projects get expensive.
| Option | Typical cost (USD) | Expected benefit mechanism | Downsides / gotchas |
|---|---|---|---|
| Diver bottom cleaning | $2–$6/ft per cleaning | Drag reduction; can recover a few % to 10%+ speed if slimy | Recurs often; depends on local growth rate |
| Haul + pressure wash | $12–$25/ft | Restores baseline; prep for paint | Yard time; zincs and thru-hulls get disturbed |
| Bottom paint job (yard) | $1,500–$5,000 | Long-term drag control; consistent performance | Prep quality matters more than brand name |
| Folding/feathering prop | $1,800–$6,000 | Less prop drag under sail; better sailing VMG | Cost; maintenance; correct sizing critical |
| Fixed prop repitch | $150–$400 | Better engine loading near hump; can reduce fuel burn | Doesn’t reduce sailing drag; trial data needed |
| Speed/DST transducer | $150–$900 | Better STW data; improves polar/VMG decisions | Thru-hull flooding risk if poorly installed |
| NMEA 2000 kit | $600–$1,800 | Cleaner data network; less voltage drop/noise | Requires proper fusing and terminations |
| Performance processor/software | $500–$3,500 | Targets, true wind, polars; better route and trim decisions | Garbage-in/garbage-out if sensors aren’t calibrated |
Safety and Standards for Speed Sensors and Performance Systems
Thru-hull installations and flooding risk (ABYC H-27)
Many performance upgrades require hull penetrations: paddlewheel speed logs, DST transducers, temperature sensors, or forward-looking sonar. If you’re adding or replacing a transducer, treat it as a flooding risk first and a data source second. ABYC H-27 is the right framework here: proper seacock/valve selection, solid backing, accessible operation, and correct hose and clamp practices when applicable.
If you can’t reach the seacock in 10 seconds without moving half your pantry, it’s not “accessible,” it’s decorative. I’ve seen more than one boat with a beautiful chartplotter fed by a transducer installed like an afterthought.
Electrical integration and network hygiene (ABYC E-11)
Modern instruments fail more often from wiring sins than from bad hardware. ABYC E-11 covers the basics that keep electronics reliable: correct conductor sizing, proper terminations, chafe protection, and overcurrent protection placed correctly. On NMEA 2000 networks, poor power injection, corroded tees, or voltage drop can make wind and speed numbers jumpy, which ruins polars and can mislead you when you’re trying to validate “hull speed” claims.
A clean backbone, sane fusing, and labeled wiring are not glamorous upgrades. They’re the difference between trustworthy data and a cockpit argument about whose instrument is lying.
Stability considerations when chasing speed (ISO 12217)
When you push into surfing/planing speeds—especially at SLR 1.6–2.0—loads rise quickly and stability margins matter. ISO 12217 is the broader stability and buoyancy assessment context for small craft categories, and while most owners won’t read it cover-to-cover, the seamanship lesson is simple: reduce sail earlier downwind, keep steering under control, and respect sea state.
If your boat starts requiring constant aggressive helm input at 9–11 kn, that’s your signal to back off before the boat makes the decision for you. Speed is only fun when it’s optional.
Frequently Asked Questions
How do I convert the hull speed formula to metric and verify it with Froude number (Fn = 0.40) for my LWL in meters?
Use Vh(kn) ≈ 2.43 × √LWL(m) for the quick metric estimate. To cross-check with physics, compute V = Fn × √(g×L) with g = 9.81 m/s², L in meters, and V in m/s, then convert to knots (1 m/s = 1.944 kn). Example: Fn 0.40, LWL 10 m → V = 0.40×√(9.81×10)=3.96 m/s=7.7 kn, which aligns closely with the 1.34 rule-of-thumb region.
If my GPS shows 9.0 kn on a 30 ft LWL monohull (Vh ≈ 7.34 kn), how do I separate current-assisted SOG from true boatspeed through the water using reciprocal runs?
Run two steady legs on opposite headings for 5–10 minutes each, holding similar sail trim and RPM (if motoring), and record both SOG and STW. Average the two SOG values to largely cancel current, and compare that averaged value to STW; the remaining difference helps estimate the current component. If your “9.0 kn” disappears when averaged reciprocally, it was current, not magic.
What speed–length ratio (SLR) indicates I’m likely surfing/planing (e.g., SLR 1.6–2.0), and which hull-form parameters (prismatic coefficient, wetted surface) most affect that threshold?
For many modern light monohulls, repeated bursts or sustained periods around SLR ~1.6–2.0 usually indicate surfing or planing assistance from waves and dynamic lift. Higher prismatic coefficient and flatter aft sections tend to support higher-speed regimes, while high wetted surface area and fuller shapes add drag that makes the hump feel steeper. Stability and rudder authority often become the real limit before the math does.
How does propeller pitch vs hull speed show up as engine overload near the resistance hump, and what sea-trial data (RPM, fuel burn, STW) supports a repitch decision?
As you approach the resistance hump, the boat demands disproportionately more shaft power for the last 0.5–1.0 kn, so an overpitched prop can prevent the engine from reaching rated RPM and can increase soot, EGT, and fuel burn. Collect sea-trial data at multiple throttle settings: RPM, STW, and fuel burn (or at least GPH), ideally on reciprocal headings to reduce current effects. If WOT RPM is consistently low by more than about 100–200 RPM at normal load and the boat gains little speed near the top, a $150–$400 repitch is often justified.
For multihulls, how does hull slenderness ratio change wave-making resistance compared with a monohull, and why does that make the 1.34×√LWL rule underpredict typical cruising speeds?
Slender multihull hulls generate less wave-making resistance at a given speed because their wave systems are smaller for the displacement carried, so they can operate efficiently at higher speeds for the same effective LWL. That’s why many cruising cats can sustain roughly 8–12 kn in moderate conditions, while a similar-length displacement monohull may live closer to its SLR ~1.2–1.35 comfort zone. The 1.34×√LWL rule is tuned to typical displacement monohull behavior near the hump, so it often underpredicts multihull cruising speeds.
If you want the practical workflow: calculate Vh from LWL, then treat it as the start of the hump discussion, not the end of the speed discussion. Use polars and VMG targets for real sailing decisions, validate “over hull speed” claims with STW vs SOG and reciprocal runs, and plan passages with distance plus currents—Breezada’s sea distance calculator makes that last part refreshingly quick.
About the Author
Related Articles
Sailing Right of Way Rules: COLREGs Made Simple
Learn sailing right of way rules with simple COLREGs scenarios—tack, overtaking, crossing, lights, and priority exceptions. Read & use the cheat sheet.
By Breezada Team

How to Read GRIB Files for Sailing and Avoid Errors
Read the guide and start sailing smarter today. Explore key tips, gear, and routes—click to learn more.
By Breezada Team
Crossing the Pacific by Sailboat: Routes & Season Guide
A complete guide to crossing the Pacific by sailboat — the three main routes, cyclone-season timing, boat and gear requirements, realistic costs, and what 21 days at sea actually looks like.
By Breezada Team
Sailing Around the World: Routes, Costs & Timeline
A working sailor's guide to sailing around the world — the classic tradewind route, real costs by year, the three-to-five year timeline, and the practical preparation that actually matters before you leave.
By Breezada Team